Every marketing vendor your dealership works with will happily show you their ROI numbers. Cost per lead is down. Impressions are up. Click-through rate improved quarter over quarter. The dashboard looks great. And yet, when you compare those numbers to what actually sold last month, something never quite adds up.
That disconnect is not a coincidence. It is the inevitable result of measuring car dealership marketing ROI the wrong way using metrics that were designed to make vendors look productive, not metrics that reflect what your marketing is actually doing to your revenue.
Measuring marketing ROI the right way requires connecting marketing spend to sold customers and gross profit not to leads, clicks, or impressions. And doing that requires a category of data that most dealerships have never systematically collected.
👉 Car dealership marketing ROI is not a reporting problem. It is a data problem. The metrics most dealerships track were never designed to answer the question that actually matters: which marketing sources are producing sold customers?
Why the Standard ROI Metrics Fail Dealerships
Before examining the right way to measure marketing ROI, it is worth being precise about why the standard approach produces numbers that feel unreliable because the problem is structural, not accidental.
The Cost Per Lead Problem
Cost per lead is the most widely used marketing ROI metric in automotive retail. It is also almost entirely disconnected from revenue.
Cost per lead measures how cheaply a marketing source can generate a form submission or inbound contact. It says nothing about the quality of that contact, the likelihood of that person purchasing, the gross profit they will generate when they do, or whether the source actually influenced the buyer or simply happened to be the last thing they clicked before submitting.
A vendor producing 200 leads per month at $30 each looks dramatically better in a cost per lead report than a vendor producing 40 leads at $150 each. But if the first vendor's leads close at 4% and the second vendor's leads close at 30%, the math tells a completely different story and that story is the one that actually affects revenue.
⚠ Cost per lead rewards vendors that are good at generating form submissions. It has almost no relationship with which vendors are good at creating buyers. Optimizing for cost per lead actively pushes dealership marketing budgets toward the wrong sources.
The Vendor Reporting Problem
Every marketing vendor your dealership pays measures its own performance using data from its own platform. That data is not neutral. It is structurally biased toward making the vendor look as valuable as possible, because the vendor's revenue depends on your continued spend.
Impression-based platforms report impressions. Click-based platforms report clicks. Lead generation platforms report lead volume. None of them can see what happened after the buyer left their platform. None of them can tell you whether the buyer they claim credit for actually signed a deal. And none of them have any incentive to surface data that might suggest their spend should be reduced.
This is not a criticism of any individual vendor. It is the nature of a system where every platform measures its own impact using metrics it controls. The only ROI data your dealership can trust is data it collects independently data the vendor cannot influence, manipulate, or selectively present.
The Last-Touch Attribution Problem
Even when dealerships move beyond vendor-provided reports and look at their own CRM source data, they run into a third structural problem: last-touch attribution.
CRM and DMS source reports record where a customer submitted a lead the last digital touchpoint before the form was filled. The automotive buying journey involves weeks of research across many channels before that moment. The buyer may have seen social advertising, browsed a listing site, heard a radio spot, watched video reviews, and received a personal recommendation before ever submitting a contact form on the dealership website.
The source report gives 100% of the credit to the website. Every other channel that shaped the decision receives zero. Marketing budget decisions made from that data consistently over-reward channels that capture demand while defunding the channels that build it.
What Real Car Dealership Marketing ROI Actually Looks Like
Measuring car dealership marketing ROI correctly means connecting marketing spend to the outcome that actually generates revenue: a sold customer. Not a lead. Not a click. Not an impression. A sold customer and the gross profit that sale produced.
The formula is straightforward. The data required to fill it in is where most dealerships have a gap.
📈 The Correct Car Dealership Marketing ROI Formula
This ratio tells you how many dollars of gross profit each marketing dollar produced by source, by month, connected to actual deal records.
This formula produces a number that is genuinely useful for budget decisions. A source with a ratio above 1.0 is returning more gross profit than it costs. A source below 1.0 is consuming more than it produces. Sources can be ranked, compared, and evaluated against each other on a basis that reflects real revenue impact not platform activity.
The challenge is the numerator. To know the gross profit from sold customers influenced by a given source, you need to know which sources each sold customer was influenced by. That data does not live in any vendor dashboard, any CRM report, or any DMS source field. It lives with the buyer and the only way to get it systematically is to ask.
The Marketing Metrics That Actually Predict Revenue
Replacing cost per lead as your primary ROI metric does not mean abandoning quantitative measurement. It means measuring the right things metrics that have a direct relationship with sold volume and gross profit rather than with platform activity.
✖ Metrics That Feel Like ROI
Cost per lead rewards cheap form submissions, not buyers.
Impressions / reach measures exposure, not influence.
Click-through rate measures ad engagement, not purchase intent.
Lead volume by source last-touch only; misses most influence.
Vendor-reported conversions measured by the vendor, for the vendor.
✔ Metrics That Reflect Real ROI
Cost per influenced sold customer spend divided by sold units the source influenced.
Gross profit per influenced deal which sources produce your highest-value buyers.
Influence rate by source what percentage of sold customers mention each source.
Close rate by attributed source how often influenced buyers actually sign deals.
Revenue ratio gross profit generated per dollar of marketing spend.
Every metric in the right column requires the same input: knowing which marketing sources each sold customer was influenced by, connected to their actual deal record. This is what sold customer attribution provides and it is what makes the difference between marketing budget decisions that grow revenue and ones that simply redistribute spend between vendors based on whoever produces the most convincing dashboard.
What Sold Customer Attribution Reveals About Your Marketing Mix
When a dealership begins collecting sold customer attribution data asking real buyers at the point of sale which sources influenced their decision the results consistently reveal the same pattern: the marketing mix that looks optimal in lead reports is not the marketing mix that is actually creating buyers.
Some sources that generate high lead volumes turn out to influence a small fraction of sold customers. Some sources that generate almost no leads turn out to have influenced a large portion of buyers they just did their work earlier in the journey and never received last-touch credit.
📊 The Same Marketing Budget Two Completely Different ROI Stories
What standard reporting tells you about your marketing spend versus what your sold customers would actually say.
Standard ROI Report (Cost Per Lead)
✖ Budget conclusion: double paid search, cut social, eliminate broadcast.
Sold Customer Attribution (ReferralTrace)
✔ Budget conclusion: social and referrals are your best ROI. Shift spend accordingly.
In this example, the source that looked like the strongest performer on cost per lead turns out to have the highest cost per influenced sold customer nearly five times worse than social media advertising, which looked like the weakest performer by standard metrics. A dealership following the standard report would be actively moving budget away from its most efficient channel and toward its least efficient one.
This is not an edge case. It is the predictable output of a measurement system built around last-touch lead attribution applied to a purchase journey that spans weeks and many channels.
How to Collect the Attribution Data That Makes This Possible
Understanding that sold customer attribution is the right foundation for car dealership marketing ROI is one thing. Collecting it consistently, at scale, and in a format that connects to deal records is another. There are a few approaches dealerships take with meaningfully different results.
Asking Informally at the Point of Sale
Many dealerships already ask customers how they heard about the store. The problem is consistency. Different salespeople ask different questions in different ways. Responses are recorded inconsistently, if at all. The data that ends up in the CRM is too fragmented and unreliable to base budget decisions on.
Post-Sale Surveys
Email or text surveys sent after the sale can gather attribution data but response rates are typically low, and the customers who respond may not be representative of the full buyer population. Recency bias also affects responses: buyers surveyed days after the sale will disproportionately remember the last few things they interacted with rather than the full arc of their research journey.
Structured Point-of-Sale Attribution
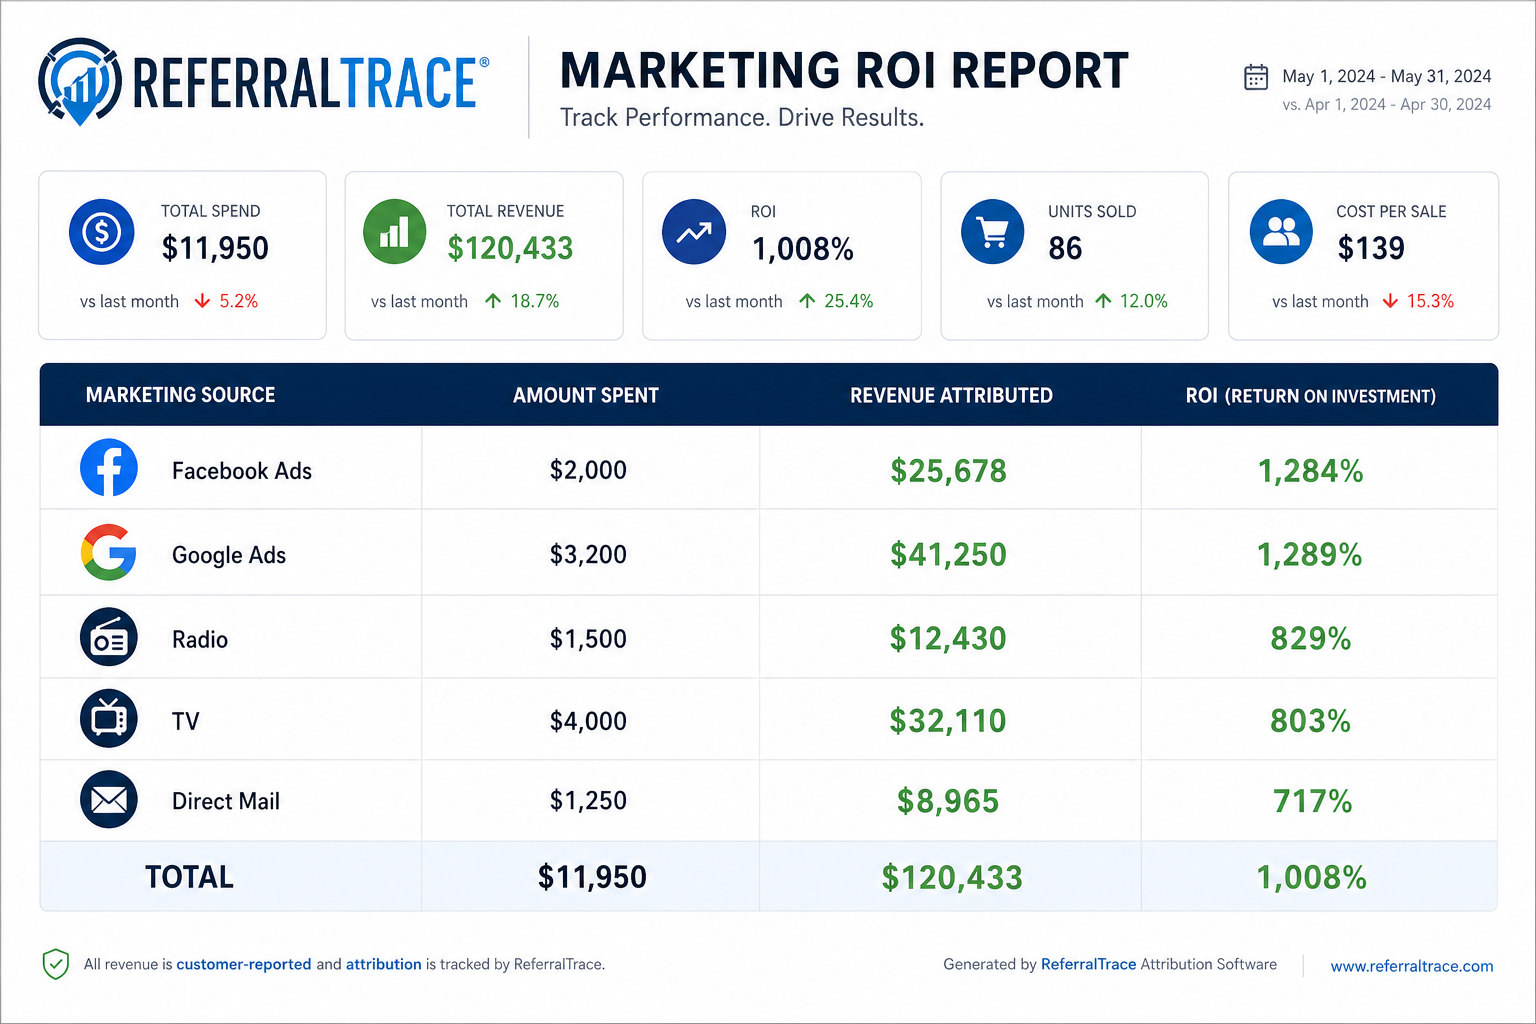
The most reliable method is a structured attribution process built directly into the point-of-sale workflow asking the buyer at the moment the deal is signed, using a consistent format, and automatically connecting the response to the deal record. This is what ReferralTrace is built to do.
At the moment of sale, ReferralTrace captures which sources the buyer was exposed to, where they researched, and what influenced their decision to choose your dealership. That data is structured not a free-text field, but a consistent format that enables reliable aggregation and reporting and it is linked to the actual deal, including gross profit, vehicle, zip code, and date.
👉 The buyer at the point of sale is the only person who was present for every step of their own purchase journey. Structured attribution at that moment produces data no digital tracking system, vendor dashboard, or CRM report can replicate.
Putting Sold Customer Attribution Into Practice
Switching from cost per lead to sold customer attribution as your primary ROI metric does not require replacing your existing marketing stack or disrupting your current vendor relationships. It requires adding a structured data collection step at the point of sale and a reporting layer that makes that data actionable.
Map every active marketing source
List every vendor, platform, and channel your dealership is currently spending on paid search, social, listing sites, broadcast, referral programs, direct mail, third-party leads. This becomes the attribution menu your buyers will respond to.
Capture attribution at every deal signing
Using ReferralTrace, introduce a structured attribution step at the point of sale for every sold customer new, used, and fleet. Consistency is what makes the data statistically meaningful. Sporadic collection produces noise, not intelligence.
Connect attribution responses to deal records
Link each buyer's attribution response to their actual deal vehicle, gross front and back, zip code, and sale date. Now you can filter by model, by geography, by gross range, and see which sources are producing your best buyers in your best markets.
Calculate cost per influenced sold customer by source
Divide your monthly spend on each source by the number of sold customers who mentioned that source. This is your true cost per influenced sold unit the metric that makes honest vendor comparison possible for the first time.
Place attribution data next to your existing source reports
The gaps between your CRM lead source report and your sold customer attribution report reveal which sources last-touch attribution is over-crediting and which it is systematically ignoring. Those gaps are your budget reallocation opportunity.
Make incremental budget shifts and measure the outcome
Start by moving 10–20% of spend from your highest cost-per-sold-unit sources to your lowest. Track influence rates and sold volume over 60–90 days. Attribution data makes the impact of those shifts visible in a way that cost per lead reporting never can.
What Changes When You Measure Car Dealership Marketing ROI Correctly
Dealerships that switch from cost per lead to sold customer attribution as their primary ROI metric consistently report the same experience: the marketing conversations change. Vendor meetings shift from reviewing impression share and click-through rates to discussing how many sold customers mentioned their platform last month. Budget decisions become defensible with data instead of instinct. And the marketing mix gradually shifts toward the sources that are actually creating buyers.
| Situation | With Cost Per Lead ROI | With Sold Customer Attribution ROI |
|---|---|---|
| Vendor asks to increase budget | Evaluated on CPL and lead volume they self-report | Evaluated on cost per influenced sold unit from your data |
| Social media advertising performance | Looks expensive high CPL, few direct lead submissions | True influence on buyer awareness captured at point of sale |
| Referral program value | Invisible referred buyers submit through website or phone | Captured at signing; shown as cost per sold unit |
| Broadcast / offline media | No trackable leads; appears to produce no ROI | Buyer mentions captured; influence rate and cost per unit visible |
| Month-over-month revenue variance | Explained by gut feel or market conditions | Traced to changes in which sources influenced sold customers |
| Cutting underperforming spend | Risk of cutting a channel that influences buyers but not leads | Cut with confidence based on actual sold customer influence data |
The single most important shift is in how vendor relationships work. When your dealership can walk into a vendor review with an independent count of how many sold customers mentioned their platform last quarter data the vendor did not collect and cannot edit the conversation is fundamentally different. Vendors that are genuinely creating buyers welcome it. Vendors that have been surviving on favorable last-touch attribution do not.
⚠ Every month your dealership measures marketing ROI using cost per lead, you are making budget decisions with a metric your vendors designed to make themselves look productive not a metric designed to show you which sources are creating buyers. The gap between those two things is where dealership marketing budgets are misallocated at scale.
The Marketing ROI Question Worth Asking Every Month
Car dealership marketing ROI does not have to be a number you guess at, a metric you accept from vendors, or a report you look at and distrust. It can be a clear, deal-level number how much gross profit did each marketing source contribute per dollar spent based on data that came directly from your sold customers.
Getting there requires changing the question. Not "which vendor produced the most leads at the lowest cost?" but "which vendors were mentioned by the most sold customers, and what did we spend to get there?"
That question has a precise, measurable answer. Collecting it requires a structured attribution process at the point of sale. Turning it into budget decisions requires connecting those responses to deal records. And acting on it consistently is what separates dealerships that grow their marketing ROI year over year from those that continue paying the same vendors for the same metrics and wondering why the numbers never quite reflect the revenue.
ReferralTrace is built to make that process systematic capturing sold customer attribution at scale, connecting it to real deal data, and delivering the ROI reporting that makes car dealership marketing spend finally accountable to the outcome that matters.
Stop measuring ROI in leads. Start measuring it in sold customers.
ReferralTrace captures sold customer attribution at the point of sale connecting your marketing spend to real buyers, real deals, and real gross profit. See which sources are actually earning their budget.
Talk to ReferralTrace →